Biotech
Dummy paragraph one - a short overview of the subsector, what it covers and why it matters in the current market environment.
Dummy paragraph two - a few sentences on key trends, dynamics and the kinds of companies operating in this space.
Dummy paragraph three - how Flow has been working with founders and investors across this subsector and what we typically help with.
Biotech is part of Digital health.
$1.6T
Global market size
1447
Public companies
Key VC investors
Key strategic buyers
How biotech companies monetize?
The dominant revenue streams, pricing mechanics and unit economics that define this subsector.
Subscription revenue
Recurring monthly or annual contracts priced per seat, per usage, or per tier - providing predictable ARR.
Transaction fees
Take rate on payments, marketplace volume or interchange, scaling directly with customer activity.
Usage-based pricing
Consumption metering on compute, API calls or data processed - gross margin tied to infrastructure cost.
Enterprise contracts
Multi-year deals with custom terms, professional services attached, and longer sales cycles.
Marketplace commissions
Two-sided platforms taking a cut of GMV, with network effects driving liquidity and pricing power.
Expansion revenue
Land-and-expand motion - upsell, cross-sell and seat growth driving net revenue retention above 110%.
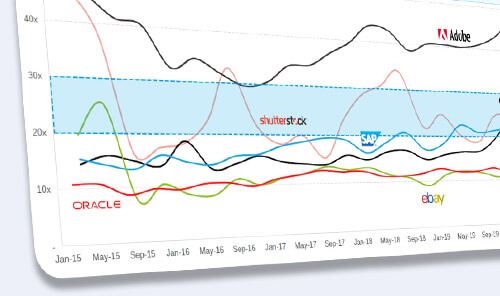
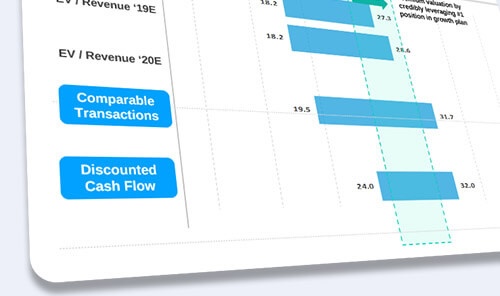
Biotech valuations in May 2026
Public biotech comps trade at 4.3x EV/Revenue. Median revenue multiple across biotech M&A deals was 3.0x in the last 12 months. Median revenue multiple across biotech VC rounds was 21x in the last 12 months.
4.3x
Median EV/Revenue as of May 2026 for public biotech companies
15x
Eli Lilly is the highest valued public biotech company based on EV/Revenue (excluding outliers)
3.0x
Median EV/Revenue across biotech M&A deals in the last 12 months
21x
Median EV/Revenue across biotech VC rounds in the last 12 months
Biotech market segments
A view of the main categories and where the value pools sit within the broader landscape.
Vertical one
Dummy description of the first vertical - the segment of the market it covers, typical players and economics.
Vertical two
Dummy description of the second vertical - what it includes, where the demand comes from and who competes.
Vertical three
Dummy description of the third vertical - its position in the stack and how it monetises end customers.
Vertical four
Dummy description of the fourth vertical - typical customer profile, deal size and growth dynamics.
Vertical five
Dummy description of the fifth vertical - competitive landscape, incumbents and emerging challengers.
Vertical six
Dummy description of the sixth vertical - adjacencies, M&A activity and where the next wave of value sits.
Fractional CFO, financial modelling and deal advice for biotech companies
See how Flow helps biotech founders.
We speak founders' language and have great operational understanding of biotech businesses.
Book an intro call - we'll look under the hood and recommend concrete next steps.
Fractional CFO
For founders who want to improve their FP&A functions, build an investor-ready financial model, and prepare for the next VC round.

Capital raising
For bootstrapped and already-VC-backed entrepreneurs who are looking to raise late stage venture or growth capital.

M&A
For category-leading technology companies who are exploring exit alternatives with either financial or strategic acquirers.

Key biotech KPIs to track
The KPIs investors, operators and acquirers focus on when underwriting companies in this subsector.
| KPI | Definition |
|---|---|
| ARR | Annual recurring revenue from subscription contracts, excluding one-off services and usage overage. The headline metric for any SaaS business. |
| Net revenue retention | Revenue from the existing customer cohort 12 months later, including expansion and net of churn - a direct read on product-market fit. |
| Gross margin | Revenue minus cost of goods sold (hosting, third-party APIs, payment processing, customer support). Tells you what's actually left to fund growth. |
| CAC payback | Months required for gross-margin contribution from a new customer to repay the cost of acquiring them. Healthy SaaS sits at 12–24 months. |
| Magic number | Net new ARR added in the quarter divided by sales & marketing spend in the prior quarter. Above 0.7 means efficient growth. |
| Rule of 40 | Sum of revenue growth rate and free cash flow margin. Above 40% signals a healthy balance between growth and capital efficiency. |
| Logo retention | Share of customers retained year-over-year, ignoring revenue expansion. The cleanest signal of churn risk in the base. |
| Burn multiple | Net cash burn divided by net new ARR. Below 1.0 means every dollar burned generates more than a dollar of new ARR. |
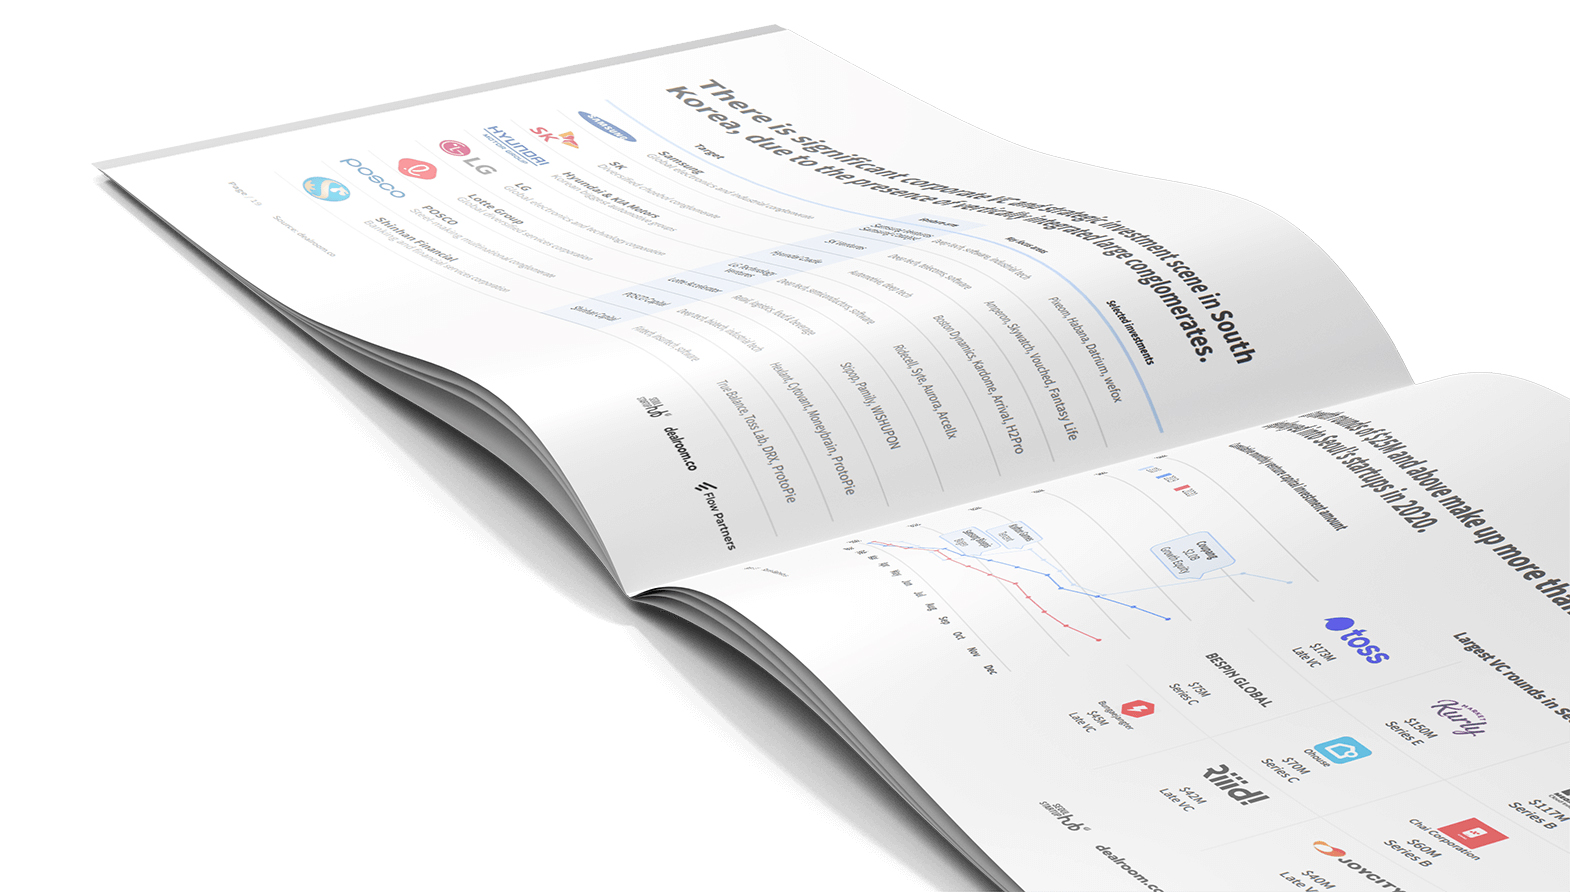
Main biotech players globally
The biggest names and most active players shaping the market right now.
| Company | HQ | Overview |
|---|---|---|
Acme Cloud acme.cloud |  San Francisco San Francisco | Cloud orchestration platform powering enterprise infra teams across regulated verticals. |
Boltflow boltflow.io |  London London | Workflow automation for product engineering, scaling from seed-stage startups to FTSE 100. |
Cobblepath cobblepath.com |  Berlin Berlin | Open-source CI/CD platform with enterprise tier - strong adoption in DACH and Benelux. |
Dustlane dustlane.dev |  Amsterdam Amsterdam | Observability stack for distributed systems with usage-based pricing across compute and ingest. |
Emberkit emberkit.io |  Stockholm Stockholm | Developer tooling for low-latency applications - fintech, trading and real-time gaming customers. |
Forge Atlas forgeatlas.com |  Toronto Toronto | Cloud-native security and policy engine sold top-down into regulated enterprise environments. |
Greylog greylog.cloud |  Singapore Singapore | Log analytics and SRE workflow platform with strong presence across APAC enterprise IT. |
Hivewire hivewire.tech |  Paris Paris | Container orchestration tuned for regulated industries - banking, public sector and defense. |
Indigo Stack indigostack.io |  Tel Aviv Tel Aviv | Platform engineering layer for modern data teams, focused on time-to-production and cost control. |
Junctra junctra.com |  Sydney Sydney | Real-time event streaming infra purpose-built for ad-tech, IoT and high-throughput marketplaces. |
CFO-as-a-service, on your terms.
Fractional CFO services scoped to your stage - a few days a month or embedded through a raise.
Key biotech market trends
The structural shifts and tailwinds investors and operators are pricing into the market today.
AI-native rebuild
Incumbents getting unbundled by AI-native challengers reshaping workflows, pricing and cost structure end-to-end.
Consolidation wave
Active M&A as strategic acquirers and PE roll-ups buy scale, distribution and product gaps from sub-scale players.
Regulatory pressure
Tightening compliance regimes raising the bar on data, security and reporting - favouring well-funded operators.
Cross-border expansion
Category leaders pushing into adjacent geographies, with localisation and partnership models accelerating GTM.
Margin compression
Pricing pressure and rising CAC squeezing contribution margin - efficiency now matters more than headline growth.
Trust & security premium
Buyers paying up for certifications, uptime and SOC-grade controls - security maturity becoming a deal-closer.
Similar verticals to biotech
Explore niches like digital therapeutics, EHR & practice management, fitness & wellness and health data & analytics.
Explore other sectors
We know tech inside & out.
We live and breath tech - true understanding of how startups operate is fundamental at what we do.


Recent insights across biotech and beyond


Talk to us
Schedule a call to get a health check on your business and see how we could help.
Fractional CFO
- Fractional CFO for Software
- Fractional CFO for AI & ML
- Fractional CFO for Fintech
- Fractional CFO for Consumer internet
- Fractional CFO for Digital media
- Fractional CFO for E-commerce & marketplaces
- Fractional CFO for Consumer products
- Fractional CFO for Mobility
- Fractional CFO for Digital health
- Fractional CFO for Industrial technology
- Fractional CFO for Digital infrastructure
- Fractional CFO for IT services
Stages
Countries
- UK Fractional CFO
- Ireland Fractional CFO
- France Fractional CFO
- Germany Fractional CFO
- Spain Fractional CFO
- Portugal Fractional CFO
- Italy Fractional CFO
- Netherlands Fractional CFO
- Belgium Fractional CFO
- Switzerland Fractional CFO
- Austria Fractional CFO
- Denmark Fractional CFO
- Sweden Fractional CFO
- Norway Fractional CFO
- Finland Fractional CFO
- Poland Fractional CFO
- Estonia Fractional CFO
- US Fractional CFO
- Canada Fractional CFO
- Mexico Fractional CFO
- Brazil Fractional CFO
- UAE Fractional CFO
- Australia Fractional CFO
Cities
- London Fractional CFO
- Dublin Fractional CFO
- Paris Fractional CFO
- Berlin Fractional CFO
- Madrid Fractional CFO
- Lisbon Fractional CFO
- Milan Fractional CFO
- Amsterdam Fractional CFO
- Brussels Fractional CFO
- Zurich Fractional CFO
- Vienna Fractional CFO
- Copenhagen Fractional CFO
- Stockholm Fractional CFO
- Oslo Fractional CFO
- Helsinki Fractional CFO
- Warsaw Fractional CFO
- Tallinn Fractional CFO
- New York Fractional CFO
- Toronto Fractional CFO
- Mexico City Fractional CFO
- São Paulo Fractional CFO
- Dubai Fractional CFO
- Sydney Fractional CFO